HOME CONTACT SUPPORT SENSORYTEST.COM
 |
HOME CONTACT SUPPORT SENSORYTEST.COM |
|
Sensory testing professional's favorite virtual desktop. Say hello to SIMS Cloud Systems. From any device, any laptop, any iPad and even your cell phone. Log in from anywhere anytime. Inquire today. 
|
Mobile devices real test example Point your cell phone camera Easy for your respondents 
Link |
 VIEW REPORTS
 |
QUESTION CHOICES |
TEST CHOICES |
View More Reports |
|
Top/Bottom 2 Boxes & 3 Boxes & 4 Boxes Advanced Analysis, and ALL Boxes Individually Analysis:
The Top/Bottom 2 Boxes & 3 Boxes & 4 Boxes Advanced Analysis Reports in SIMS Sensory Quality Panel Software Cloud Systems summarizes the extreme observations for Hedonic Attributes. Market research studies often refer to positive and negative rating measures using the Top/Bottom 2 Boxes & 3 Boxes percentages as indicators of consumer acceptance. Special thanks to Mr. Thomas Carr who was instrumental in the development of the proper specifications for statistics that were incorporated in all Top/Bottom 2 Boxes & 3 Boxes reports. Some of these statistic specifications are discussed below. Index of this Web Page:
1. Print Screen of the Excel Report showing Top2/Middle/Bottom2 and and ALL Boxes Individually. 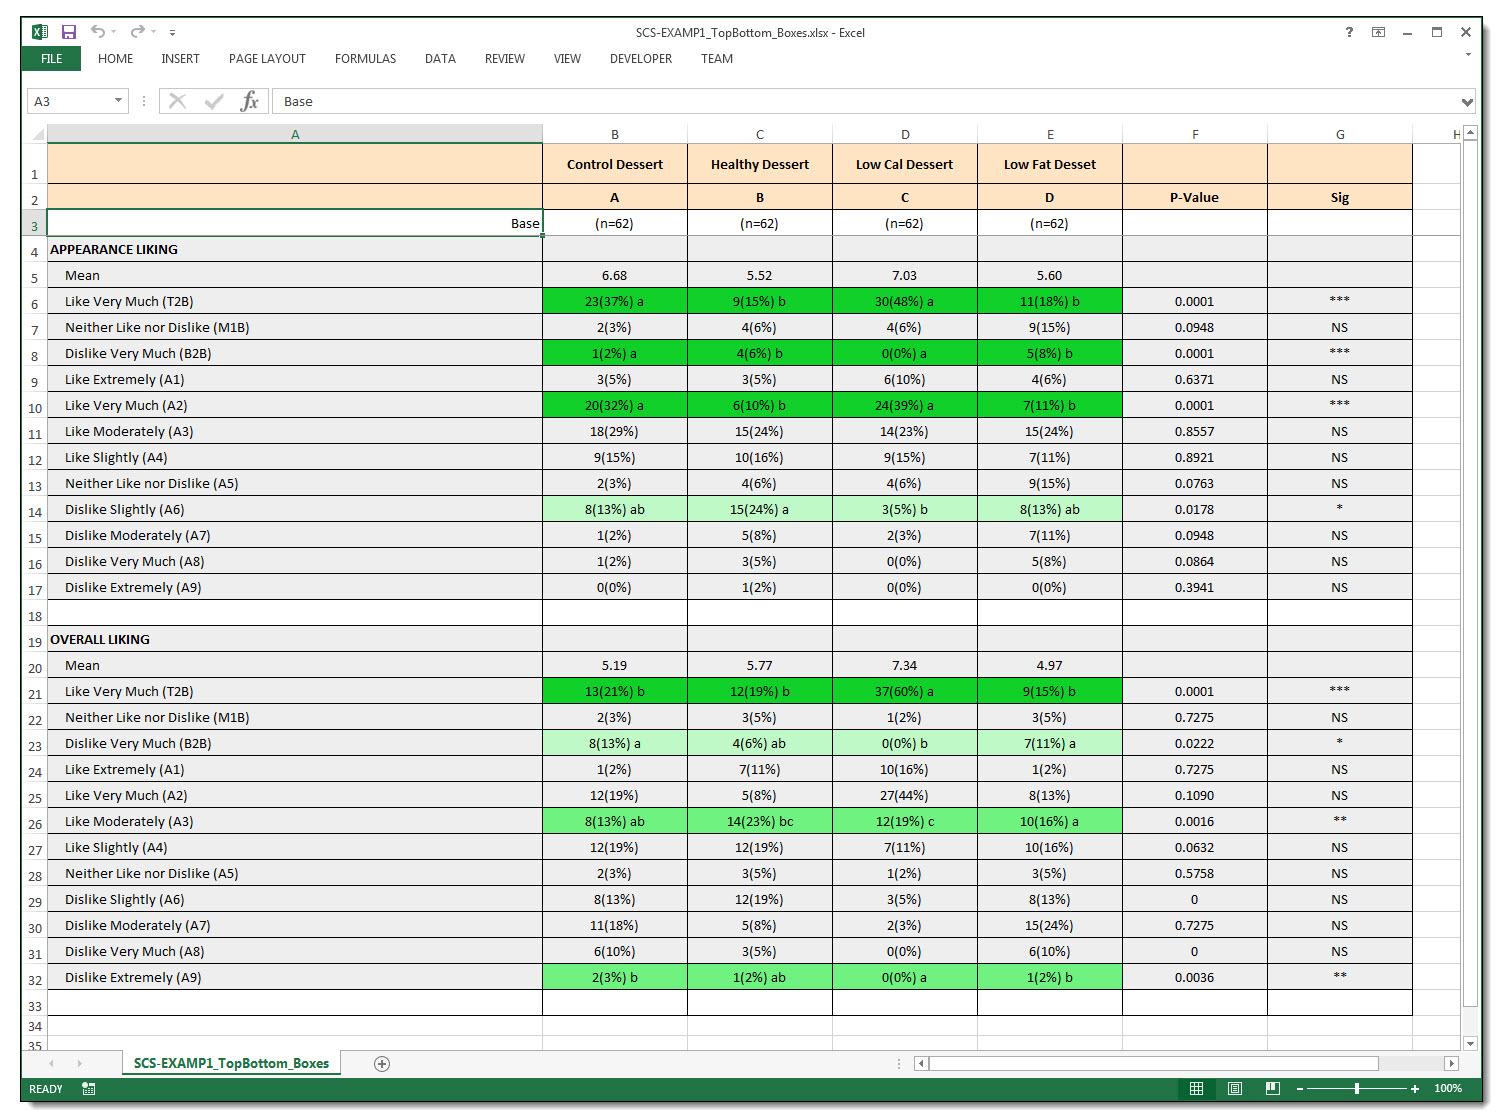
2. Print Screen of the Table Report, Ready for Sending to MS Word, showing Top2/Middle/Bottom2 and ALL Boxes Individually. 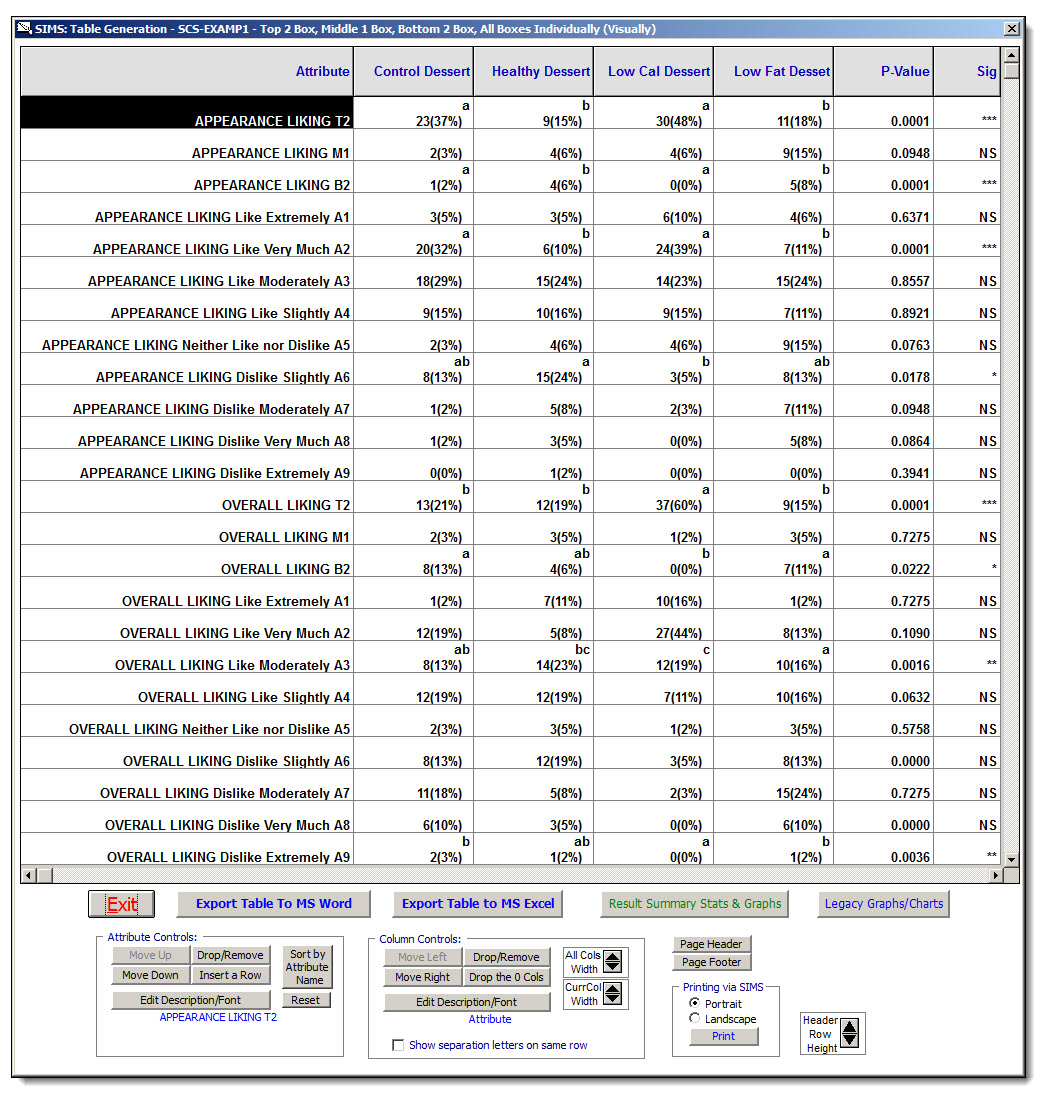
3. Print Screen of Main Report Selection Form, easy to use and fun to play with the options available. 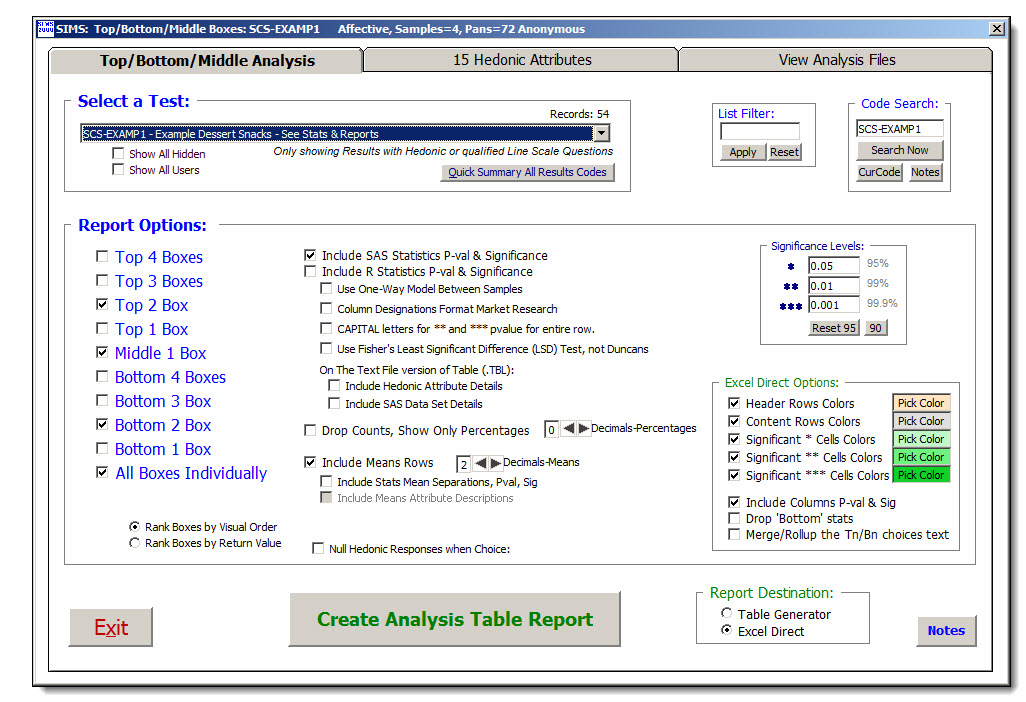
SIMS software express package file: SCS-EXAMP1.SIMS2000ExpressPackage.sql.ZIP |